Households according to the number of members
In the book "Households according to the number of members", the Statistical Office of the Republic of Serbia publishes the final results of 2022 Census of Population, Households and Dwellings on the total number of households in the Republic of Serbia, according to the number of members and average size, by regions, areas, municipalities and settlements.
In this book, only data on private households (hereinafter: households) are presented, while the data on collective households and primary homeless people will be the subject of a separate analysis.
There is a total of 2 589 344 households in the Republic of Serbia. The average household has 2.55 members.
Table 1. Households by number of members, by regions
| Total |
1 member |
2 members |
3 members |
4 members |
5 members |
6 and more members |
Average number of members |
|
| Republic of Serbia | 2 589 344 | 773 945 | 711 946 | 459 926 | 375 565 | 156 050 | 111 912 | 2,55 |
| Beogradski region | 694 818 | 232 252 | 184 158 | 125 617 | 101 827 | 33 233 | 17 731 | 2,40 |
| Region Vojvodine | 698 452 | 215 429 | 198 871 | 123 327 | 98 162 | 39 162 | 23 501 | 2,47 |
| Region Šumadije i Zapadne Srbije | 671 500 | 181 716 | 182 605 | 117 984 | 100 115 | 48 885 | 40 195 | 2,70 |
| Region Južne i Istočne Srbije | 524 574 | 144 548 | 146 312 | 92 998 | 75 461 | 34 770 | 30 485 | 2,66 |
| Region Kosovo i Metohija | … | … | … | … | … | … | … | … |
Graph 1. Households by number of members (%), by regions
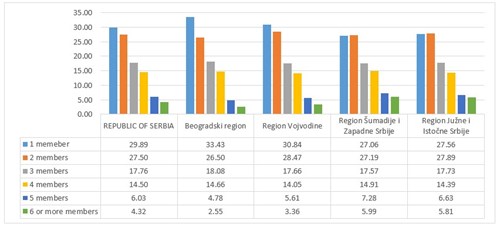
The largest share of one-person households in the total number of households is recorded in Beogradski region, where every third household is the one-person (33.4%), and in Region Vojvodine (31%). In Region Šumadije i Zapadne Srbije and in Region Južne i Istočne Srbije, two-member households are slightly more numerous than one-person households. These two regions also have a higher share of households with six or more members (close to 6%) compared to Beogradski region, where the share of households with six or more members is only 2.6%, and Region Vojvodine, where 3.4% of households has more than five members. Observed by type of settlement, the average household in urban-type settlements has 2.4 members, while households in other settlements have an average of 2.75 members.
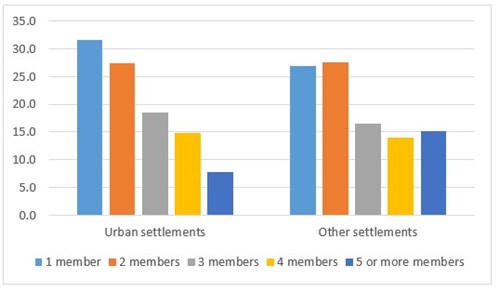
Graph 2. Households by number of members (%), by type of settlement
Data by municipalities and cities
The municipalities with the smallest average household size are: Crna Trava (1.9 members), Vračar and Stari grad (2 members), Gadžin Han, Savski venac and Babušnica (2.1 members), while the largest average household size is in: Preševo (4.5 members), Bujanovac (4.1 members), Tutin (3.5 members), Sjenica and Novi Pazar (3.4 members).
The largest share of one-person households in the total number of households is present in the municipality of Crna Trava, where almost every second household is one-person (48.5%), followed by the Belgrade municipalities of Stari grad (45.2%), Vračar (43.5%) and Savski venac (42.4%), and the municipalities of Gadzin Han (38.9%) and Babušnica (38.8%). On the other hand, the largest share of households with five or more members in the total number of households is recorded in: Preševo (47.3%), Bujanovac (38.6%), Tutin (30.5%), Sjenica (27.4%) and the city of Novi Pazar (26.6%).
Book 3. Households by number of members
Table 1. Households by number of members
Table 2. Average number of household members
- 26.04.2024. Households by the family composition and characteristics of the reference person
- 08.03.2024. The most frequent names and surnames
- 23.02.2024. Comparative overview of the number of dwellings
- 23.02.2024. Comparative overview of the number of population and households by censuses 1948–2022
- 28.12.2023. Households and Dwellings on the number of dwellings by type of buildings, year of construction and floor
- 22.12.2023. Population by individual age and by school attendance
- 01.12.2023. Population according to disability status and type of problem of persons with disabilities
- 17.11.2023. Population by economic activity
- 15.11.2023. Heating in occupied dwellings without central heating
- 20.10.2023. Families
- 12.10.2023. Installations in dwellings
- 29.09.2023. Migrations
- 25.08.2023. Marital Status and Fertility
- 24.08.2023. The number of dwellings in the Republic of Serbia according to occupant density, ownership and occupancy status
- 31.07.2023. Educational attainment, literacy and computer literacy
- 20.07.2023. Number of persons and households in dwellings and occupied premises
- 07.07.2023. Households according to the number of members
- 16.06.2023. Мother tongue, religion and ethnic affiliation
- 08.06.2023. Rooms and Auxiliary Premises in Dwelling
- 25.05.2023. Age and Sex
- 18.05.2023. Number and floor space of housing units
- 28.04.2023. Final results - Ethnicity
- 21.12.2022. First results of the 2022 Census of Population, Households and Dwellings
- 21.12.2022. Press conference - The first results of 2022 Census of Population, Households and Dwellings
- 01.12.2022. Tomorrow, December 2, 2022, the enumerators are back on the field
- 08.11.2022. TELEPHONE NUMBERS OF ON-DUTY ENSUMERS BY MUNICIPALITIES AND CITIES
- 07.11.2022. Today, November 7, 2022, at 8 p.m., field data collection in the 2022 Census ends
- 31.10.2022. CENSUS 2022 is entering the final phase of implementation on the ground
- 25.10.2022. Meeting with the High Commissioner on National Minorities of the Organisation for Security and Cooperation
- 21.10.2022. In 20 days, more than 4.7 million citizens have been enumerated in 2022 Census
- 07.10.2022. In six days, more than 1,350,000 inhabitants have been enumerated.
- 30.09.2022. 2022 Census of Population, Households and Dwellings begins
- 26.09.2022. Workshop on Census
- 20.09.2022. Final list of selected enumerators
- 16.09.2022. Census info-center 2022 has started working
- 08.09.2022. Meeting of the representatives of the Embassy of Great Britain
- 01.09.2022. Training of enumerator candidates
- 26.08.2022. Final list of candidates for enumerators invited for training
- 20.08.2022. Preliminary list of candidates for enumerators invited for training
- 18.08.2022. Information workshops for members of national councils of national minorities on the occasion of the upcoming Census
- 12.08.2022. The final list of selected instructors
- 10.08.2022. Ranking list of registered candidates for enumerators
- 08.08.2022. Ranking lists of registered enumerator candidates are published on August 10
- 22.07.2022. Public call for registering enumerators
- 22.07.2022. Final list of instructor candidates invited for training
- 21.07.2022. The final list of candidates for IT assistants who passed the 2nd round of the public call
- 19.07.2022. Media conference on the occasion of 2022 Census of Population, Households and Dwellings in the Republic of Serbia
- 15.07.2022. Announcement of public call for enumerators
- 13.07.2022. Preliminary list of candidates for IT assistants, second round
- 06.07.2022. Ranking list of candidates for instructors in the Census 2022 who are invited to submit documentation, test and interview
- 05.07.2022. List of registered candidates for work as an IT assistant, second round
- 29.06.2022. The second public call for applicants to work as an IT assistant
- 28.06.2022. Final list of candidates for IT assistants
- 24.06.2022. Public call for candidates for instructors in the 2022 Census
- 22.06.2022. Preliminary list of candidates for IT assistants
- 21.06.2022. Training of municipal and regional coordinators
- 17.06.2022. About 2,500 instructors will be needed to conduct the 2022 Census in the Republic of Serbia
- 14.06.2022. List of registered candidates for work as an IT assistant
- 08.04.2021. Field implementation of the Census from October 1st to October 31st, 2022
LATEST NEWS
Share this page |
|
|