Households by the family composition and characteristics of the reference person
The Statistical Office of the Republic of Serbia publishes the final results of 2022 Census of Population, Households and Dwellings on households by family composition and number of members, as well as data on households by age and sex of the household head and family composition, up to the regional level.
Out of a total of 2 589 344 households in the Republic of Serbia, 1 757 507 (67.9%) are family households, i.e. households with at least one family, while 831 837 (32.1%) are non-family households, i.e. 773 945 one-person and 57 892 multi-person non-family households.
Table 1. Households by family composition
| Number of households | |
| REPUBLIC OF SERBIA | 2 589 344 |
| Family households | 1 757 507 |
| Without other members | 1 532 131 |
| With other members | 225 376 |
| Single-family households | 1 619 945 |
| Married couple without children | 429 364 |
| Consensual couple without children | 50 692 |
| Married couple with children | 719 140 |
| Consensual couple with children | 65 165 |
| Mother with children | 278 663 |
| Father with children | 76 921 |
| Two-family households | 128 836 |
| Three or more - family households | 8 726 |
| Non-family households | 831 837 |
| One-person households | 773 945 |
| Multi-person households | 57 892 |
Chart 1. Households by family composition
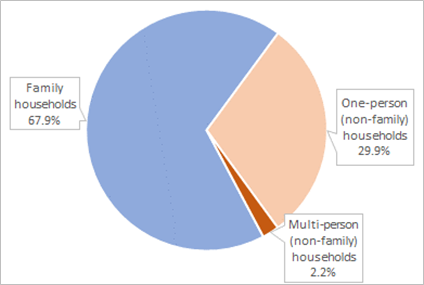
The majority of family households (87.2%) have only family members in their composition, while 12.8% of family households have, in addition to family members, other household members who do not belong to any family.
Among family households, the most represented are single - family households (92.2%), while the share of households with two or more families is 7.8% (there are 128 836 households with two families - a share of 7.3% and the number of three or more - family households is 8 726, a share of 0.5%).
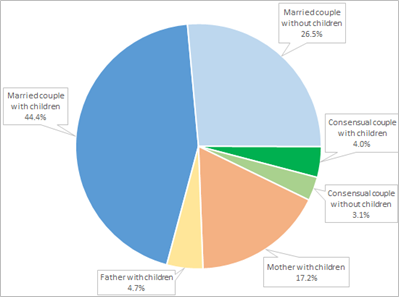
In single – family households (1 619 945), the most represented family type is "married couple with children" (44.4%), followed by "married couple without children" (26.5%), "mother with children" (17 .2%), "father with children" (4.75%), "consensual couple with children" (4%) and "consensual couple without children" (3.1%).
Chart 2. One-family households by family type
The share of non-family households in the total number of households increased in the period between the two censuses, from 24% (2011 Census) to 32% (2022 Census), which is a direct consequence of the increase in the number of one-person households from 555 467 (2011 Census) to 773 945 (2022 Census). Also, significant change was recorded in the share of families "married/consensual couple with children", which decreased from 36.4% (Census 2011) to 30.3% (Census 2022) and in the share of two-family households - a decrease from 8.4% (Census 2011) to around 5% (Census 2022).
Table 2. Households by family composition, according to 2011 and 2022 censuses
| Census 2022 | Census 2011 | |||||
| Total number of households | 2 589 344 | 100% | 2 487 886 | 100% | ||
| Family households | Single family households | Married/consensual couple without children | 480 056 | 18.54 | 459 125 | 18.45 |
| Married/ consensual couple with children | 784 305 | 30.29 | 904 877 | 36.37 | ||
| Mother with children | 278 663 | 10.76 | 238 280 | 9.58 | ||
| Father with children | 76 921 | 2.97 | 61 447 | 2.47 | ||
| Two-family households | 128 836 | 4.98 | 209 026 | 8.40 | ||
| Three or more-family households | 8 726 | 0.34 | 14 424 | 0.58 | ||
| Non-family households | One-person households | 773 945 | 29.89 | 555 467 | 22.33 | |
| Multi-member households | 57 892 | 2.24 | 45 240 | 1.82 | ||
Age and sex of the household head
The results of 2022 Census show that in 63% of households, the head of the household is male. The difference in favour of men is even more pronounced if only family households are considered. Namely, in 72% of family households, the head of the household is a man, and in 28% of households, a woman.
In non-family households, more household heads are females (in 55.6% of households, the head of the household is a woman, and in 44.4% of households, a man), primarily due to the greater number of women aged 65 and over who live alone.
The person who heads the household is 56.7 years old on average, with the average age of the head of the household in urban settlements being 55.3 years, and in other settlements the head of the household is 59.4 years old on average.
More detailed data is available in the tables in the dissemination database:
Table 1: Households by the family composition and by the number of members
Table 2: Households by the age and sex of the reference person and by the family composition
Also, the Census 2022 website, in the "Tables 2022" section, in addition to all data published so far in excel format, also available are the data on the population by ethnicity, age (including average age) and sex, by regions.
- 26.04.2024. Households by the family composition and characteristics of the reference person
- 08.03.2024. The most frequent names and surnames
- 23.02.2024. Comparative overview of the number of dwellings
- 23.02.2024. Comparative overview of the number of population and households by censuses 1948–2022
- 28.12.2023. Households and Dwellings on the number of dwellings by type of buildings, year of construction and floor
- 22.12.2023. Population by individual age and by school attendance
- 01.12.2023. Population according to disability status and type of problem of persons with disabilities
- 17.11.2023. Population by economic activity
- 15.11.2023. Heating in occupied dwellings without central heating
- 20.10.2023. Families
- 12.10.2023. Installations in dwellings
- 29.09.2023. Migrations
- 25.08.2023. Marital Status and Fertility
- 24.08.2023. The number of dwellings in the Republic of Serbia according to occupant density, ownership and occupancy status
- 31.07.2023. Educational attainment, literacy and computer literacy
- 20.07.2023. Number of persons and households in dwellings and occupied premises
- 07.07.2023. Households according to the number of members
- 16.06.2023. Мother tongue, religion and ethnic affiliation
- 08.06.2023. Rooms and Auxiliary Premises in Dwelling
- 25.05.2023. Age and Sex
- 18.05.2023. Number and floor space of housing units
- 28.04.2023. Final results - Ethnicity
- 21.12.2022. First results of the 2022 Census of Population, Households and Dwellings
- 21.12.2022. Press conference - The first results of 2022 Census of Population, Households and Dwellings
- 01.12.2022. Tomorrow, December 2, 2022, the enumerators are back on the field
- 08.11.2022. TELEPHONE NUMBERS OF ON-DUTY ENSUMERS BY MUNICIPALITIES AND CITIES
- 07.11.2022. Today, November 7, 2022, at 8 p.m., field data collection in the 2022 Census ends
- 31.10.2022. CENSUS 2022 is entering the final phase of implementation on the ground
- 25.10.2022. Meeting with the High Commissioner on National Minorities of the Organisation for Security and Cooperation
- 21.10.2022. In 20 days, more than 4.7 million citizens have been enumerated in 2022 Census
- 07.10.2022. In six days, more than 1,350,000 inhabitants have been enumerated.
- 30.09.2022. 2022 Census of Population, Households and Dwellings begins
- 26.09.2022. Workshop on Census
- 20.09.2022. Final list of selected enumerators
- 16.09.2022. Census info-center 2022 has started working
- 08.09.2022. Meeting of the representatives of the Embassy of Great Britain
- 01.09.2022. Training of enumerator candidates
- 26.08.2022. Final list of candidates for enumerators invited for training
- 20.08.2022. Preliminary list of candidates for enumerators invited for training
- 18.08.2022. Information workshops for members of national councils of national minorities on the occasion of the upcoming Census
- 12.08.2022. The final list of selected instructors
- 10.08.2022. Ranking list of registered candidates for enumerators
- 08.08.2022. Ranking lists of registered enumerator candidates are published on August 10
- 22.07.2022. Public call for registering enumerators
- 22.07.2022. Final list of instructor candidates invited for training
- 21.07.2022. The final list of candidates for IT assistants who passed the 2nd round of the public call
- 19.07.2022. Media conference on the occasion of 2022 Census of Population, Households and Dwellings in the Republic of Serbia
- 15.07.2022. Announcement of public call for enumerators
- 13.07.2022. Preliminary list of candidates for IT assistants, second round
- 06.07.2022. Ranking list of candidates for instructors in the Census 2022 who are invited to submit documentation, test and interview
- 05.07.2022. List of registered candidates for work as an IT assistant, second round
- 29.06.2022. The second public call for applicants to work as an IT assistant
- 28.06.2022. Final list of candidates for IT assistants
- 24.06.2022. Public call for candidates for instructors in the 2022 Census
- 22.06.2022. Preliminary list of candidates for IT assistants
- 21.06.2022. Training of municipal and regional coordinators
- 17.06.2022. About 2,500 instructors will be needed to conduct the 2022 Census in the Republic of Serbia
- 14.06.2022. List of registered candidates for work as an IT assistant
- 08.04.2021. Field implementation of the Census from October 1st to October 31st, 2022
LATEST NEWS
Share this page |
|
|